
Your technicians, maintenance engineers, and fleet generate massive amounts of data every day. Which remains untapped. A lot of human intelligence buried under a mammoth task of reviewing this messy data together.
These include
- Maintenance logs (yes hundreds of thousands of rows!)
- Fault codes from machines are auto-generated
- Work orders in CMMS
- Damage reports, etc
But it is either time-consuming or downright impossible to structure millions of records manually. Teams spend weeks reading entries one by one. Building categories from scratch. And assigning them to rows – this leads to never ending historical analysis and constant manual intervention.
Today we’re launching Risk Score to change that.
What Risk Score Does
Risk Score structures this messy data automatically.
You give it your existing exports / data in whatever format they’re in. Starting with exports from CMMS systems and machine-generated logs with thousands of cryptic codes.
The system processes them through four steps. You get back structured, weighted categories ready to use.
This task used to weeks, it can now happens in mins.
It works with messy data. That’s the entire point. Free text entries where technicians describe problems in their own words. Or machine-generated codes that nobody’s bothered to document properly.
We’ve now worked on over Billion rows of these messy data types to make sure the AI behind Risk Score handles it well.
When It’s Useful
Planning maintenance intervention: Identify your at-risk assets in the fleet. Which assets actually need attention based on risk profile. Our customers in Rail and Airports are already using this.
Allocating engineering resources: Your team can only be in so many places at once. Risk Score tells you where they’ll make the biggest difference today.
Preventing service disruptions: Spot patterns that lead to failures before they happen. Give your team time to intervene. Activate contingency plans early instead of reacting after passengers are affected.
Making sense of legacy data: You have years of maintenance records sitting in old systems. Nobody has time to read through them. Risk Score structures it all. Suddenly those archives become useful.
Tracking fleet-wide patterns: One asset having a problem might be random. Ten assets showing the same pattern means something systematic. Risk Score surfaces those connections.
Prioritising capital decisions: Which equipment types cause the most operational headaches? Where should you focus investment? Your data already knows. Risk Score shows you.
How Risk Scores Work
Step 1: Ingest & Clean
Upload your data.
The system looks at what you’ve given it. And runs validation to auto-correct erroneous data across a representative sample, time period, and equipment types. It gives a flag that you can review.
What used to mean days of spreadsheet work happens automatically. You can watch it process. You can see what it’s doing. But you don’t have to do it yourself.
Step 2: Extract Meaning
Natural language processing (NLP) reads every single entry. Human text or machine codes. To extract relevant insight automagically. It does formatting to strips the noise that clutters up every maintenance log ever written.
For e.g.
- a maintenance log might contain “ERR_4091_PWR” in one field.
- another entry says “drive chain slip detected during startup”.
- a third shows “HVAC_FAULT:03” with no other context.
- a fourth is just someone writing “same problem as yesterday with the cooling”.
The system reads all of it. Extracts the concepts that matter.
- Power supply issues.
- Drive chain problems.
- HVAC failures.
- Cooling system faults.
It is consistent extraction across every entry, regardless of how it was originally written. This is one of the features that differentiates it from merely using LLM apps to do this.
This Risk Score system uses determinisitic methods behind the scenes with only 10% of the work delegated to LLMs for the output.
Step 3: Build Knowledge Map
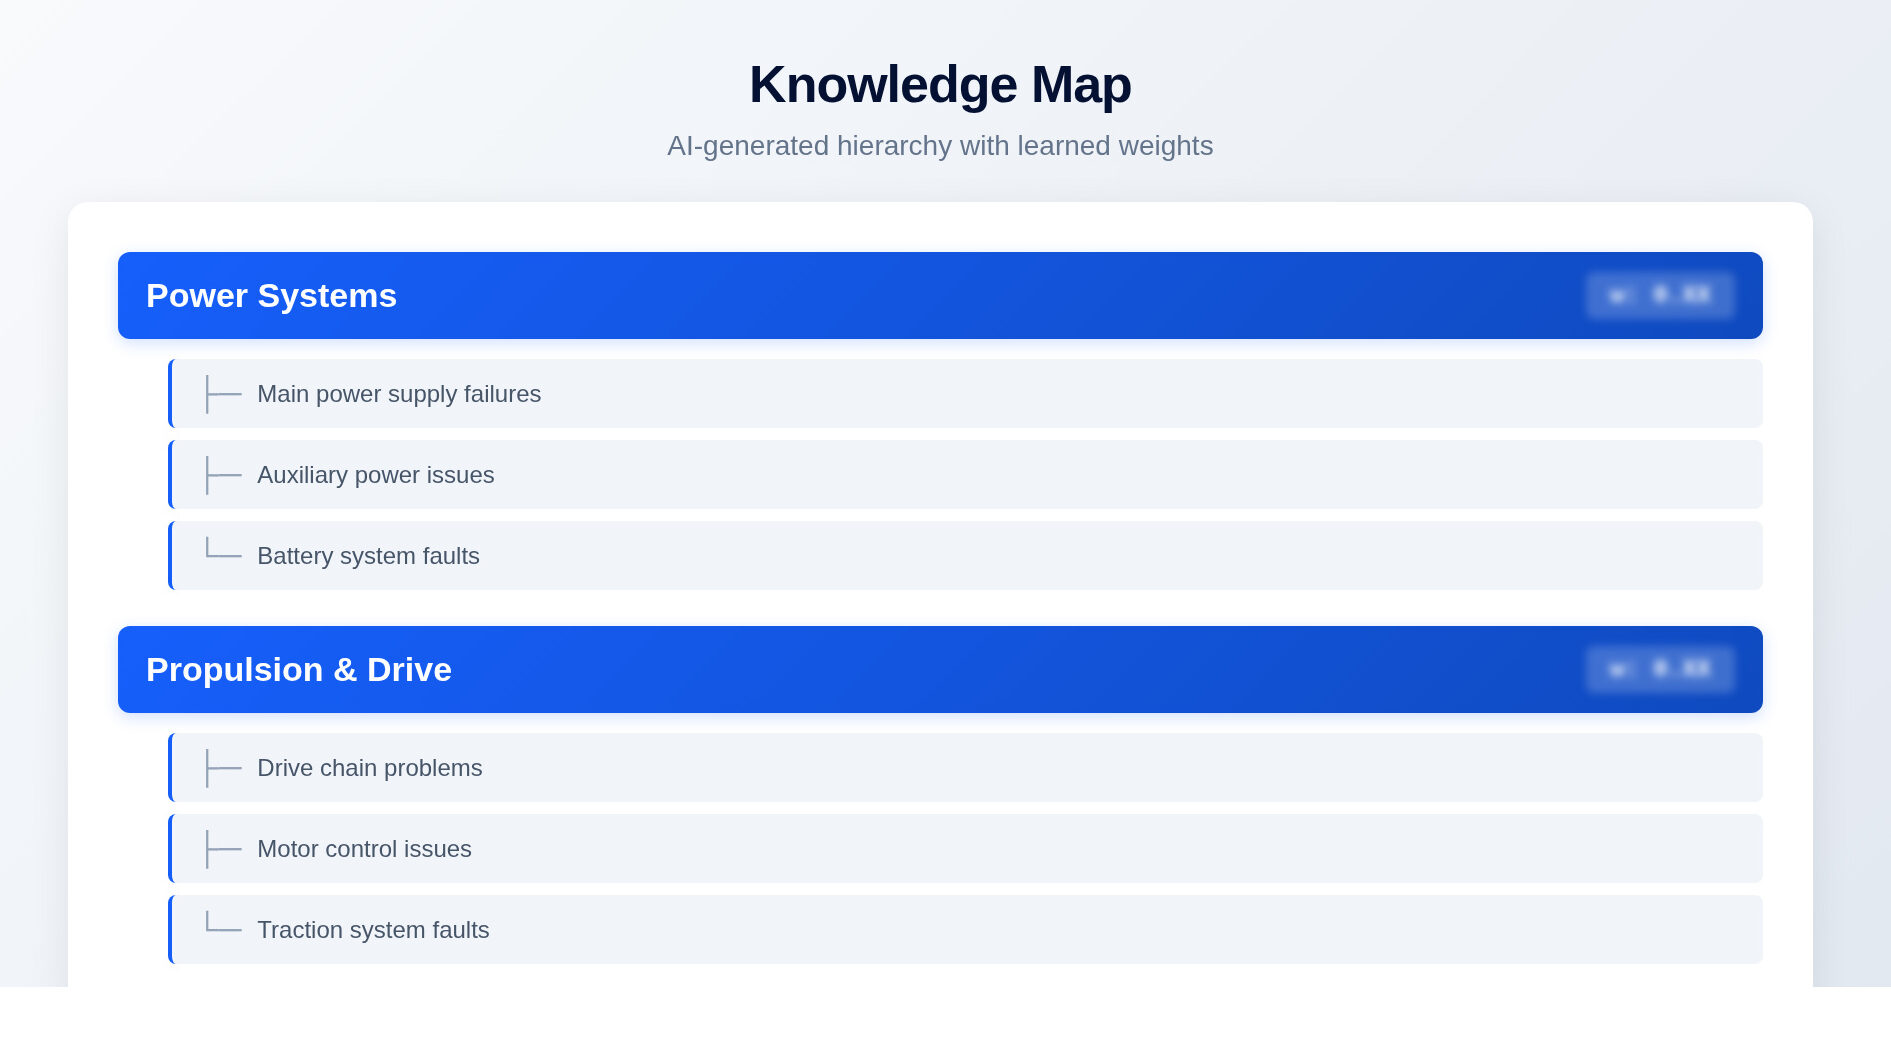
Now the AI has thousands of extracted keywords. It needs to organise them.
It analyses the full pool of keywords. Starts a pooling pattern – in a way categorising and segmenting them without manual effort. It builds a logical hierarchy.
That’s another key element we’ve implemented, that you can define the exact asset type you are using and industry. So it customises the output to your operation, rather than a generic trained model on world’s operation!
One validation project we did processed over 1,600 different fault codes. Engineers had been manually trying to make sense of them for years. The system condensed them into 57 actionable categories. Each one weighted by how much it matters to operations.
Your team can review the structure. You can edit categories. Rename them. Split them. Merge them. Add your domain knowledge. The AI instantly re-maps everything to match your corrections. You stay in control.
The AI handles the scale.
Step 4: Calculate Risk Scores
Each asset in your fleet gets a score. Real-time as logs or new maintenance entries are made in CMMS. Based on weighted factors.
The mathematical foundation combine multiple factors. Each one weighted by how strongly it has historically linked to operational issues. The weights are learned from your data, not guessed.
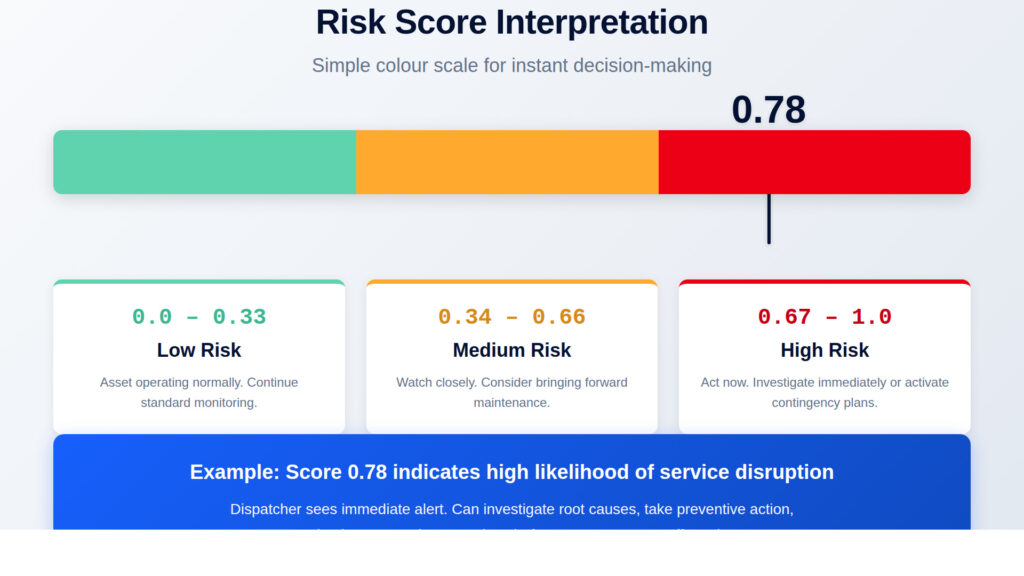
The formula maps everything to a simple 0-1 scale.
Every score is explainable. It shows exactly which factors contributed to its score.
The score appears as a simple colour scale. Green means low risk. Yellow means watch it. Red means act now. Dispatchers can scan a board of hundreds of assets and know immediately where to focus.
Validated in Real Operations
We needed to know this works in the real world.
The first deployment processed over 250 million records. Real operational data from years of service. Over 1,600 different fault codes that had accumulated across multiple systems. The kind of data nobody wants to touch because it’s too complex to structure manually.
The system condensed those codes into 57 weighted categories. Achieved 80% detection accuracy for at-risk assets. Gave operators 60 minutes of advance warning.
DB Regio began the first customer to use Risk Score to identify at-risk trains in their fleet.
Your operation will be different, as will your data and use-case. That’s fine. The underlying technology structures operational data. How you apply it is your choice.
Try It With Your Data
We’re not asking you to take our word for it.
Bring a sample export to a 30-minute demo. Could be 1,000 records. Could be 10,000. Whatever you have from your maintenance logs or machine logs.
We’ll run it through the system. Show you what patterns are already sitting in there. Let you see the structure it creates. The categories it builds. The risk scores it generates. All from your actual data.
Any operation that generates messy maintenance data. Any system that produces logs nobody has time to properly analyse.
Getting Started
Book a demo or just drop me a line on [email protected]. Happy to schedule a call let’s see what it can do for you.
FAQs for Risk Score
What is Risk Score?
Risk Score is an AI system developed by Amygda that automatically structures messy operational data from maintenance logs, fault codes, and CMMS systems. It processes millions of records and converts them into weighted, actionable categories in hours instead of the weeks required for manual analysis. The system works with existing data and requires no new sensors or infrastructure.
How does Risk Score work?
Risk Score works in four steps: First, it ingests and cleans your operational data exports, removing duplicates automatically. Second, natural language processing extracts meaningful keywords from both human text and machine codes. Third, AI organises these keywords into a logical hierarchy with weighted categories. Fourth, it calculates real-time risk scores for each asset based on learnt patterns from historical data. Every score is explainable, showing exactly which factors contributed to the assessment.
What types of data does Risk Score analyse?
Risk Score analyses maintenance logs, work orders, fault codes, damage reports, machine-generated alerts, ECU/EMU outputs, operational logs, flight recorder data, and free-text reports. It handles inconsistent formats, multiple languages, machine codes, and human-written descriptions from systems like Maximo, SAP, and other CMMS platforms.
Do I need new sensors to use Risk Score?
No. Risk Score works entirely with data you already generate through existing operations. No sensors to install, no integration projects, no infrastructure changes. Just export data from your current systems and feed it in.
How long does it take to structure operational data with Risk Score?
What traditionally takes maintenance teams weeks of manual categorisation now happens in hours with Risk Score. The system can process millions of records, identify patterns, and create weighted hierarchies in a fraction of the time required for manual analysis.
When should I use Risk Score?
- Use Risk Score when planning maintenance windows to identify which assets actually need attention.
- Use it for allocating engineering resources where they’ll make the biggest difference.
- Use it for preventing service disruptions by spotting patterns before failures.
- Use it for making sense of years of legacy maintenance data.
- Use it for tracking fleet-wide patterns that indicate systematic issues.
What problems does Risk Score solve?
Risk Score solves the problem of teams spending weeks manually reading and categorising thousands of maintenance records. It eliminates inconsistent categorisation between people, sites, and shifts. It prevents the repeated effort of rebuilding taxonomies every time new data arrives. It makes legacy archives useful by structuring years of maintenance records automatically.
Can Risk Score predict equipment failures?
Risk Score identifies patterns in operational data that historically link to service disruptions. It’s a compass, not a crystal ball—it reveals existing patterns rather than predicting unknown futures. The system gives operations teams visibility into which assets show concerning patterns based on historical evidence.
How is Risk Score different from sensor-based predictive maintenance?
Risk Score works with data you already have in your CMMS and maintenance logs. Sensor-based systems require installing new hardware and often can’t explain their predictions. Risk Score structures existing operational records, shows its reasoning, and requires no infrastructure changes. The two approaches are complementary, not competing.